WordPress chart plugin – ChartPlot
Chartplot is a wordpress chart plugin that allows you to create charts and embed them into your posts and pages.
Plugin info
Maintenance & Compatibility
Maintenance score
Possibly abandoned • Last updated 2548 days ago
Is WordPress chart plugin – ChartPlot abandoned?
Possibly abandoned (last update 2548 days ago).
Compatibility
Similar & Alternatives
Explore plugins with similar tags, and compare key metrics like downloads, ratings, updates, support, and WP/PHP compatibility.
Description
Chartplot is a wordpress chart plugin that allows you to create charts and embed them into your posts and pages.
Some of the features chartplot provides:
- Live editor with intuitive controls
- No programming knowledge required
- 8 series types to choose from, e.g. line, area or candlestick
- Combine multiple series in one chart to create complex visualizations
- Themes and hundreds of customization options to fit your needs
- Responsive charts that look great on desktop, tablet or mobile
- Based on highly popular ECharts
Documentation
Please visit our ChartplotDocs.
Feedback
We strive to improve our products and we rely on feedback from you.
Please feel free to share any feedback by sending an email to [email protected].
Installation
Frequently Asked Questions
Review feed
Screenshots

Overview of all your charts.

Select the type of chart you want to create.

Chart editor, showing the y-axis settings.
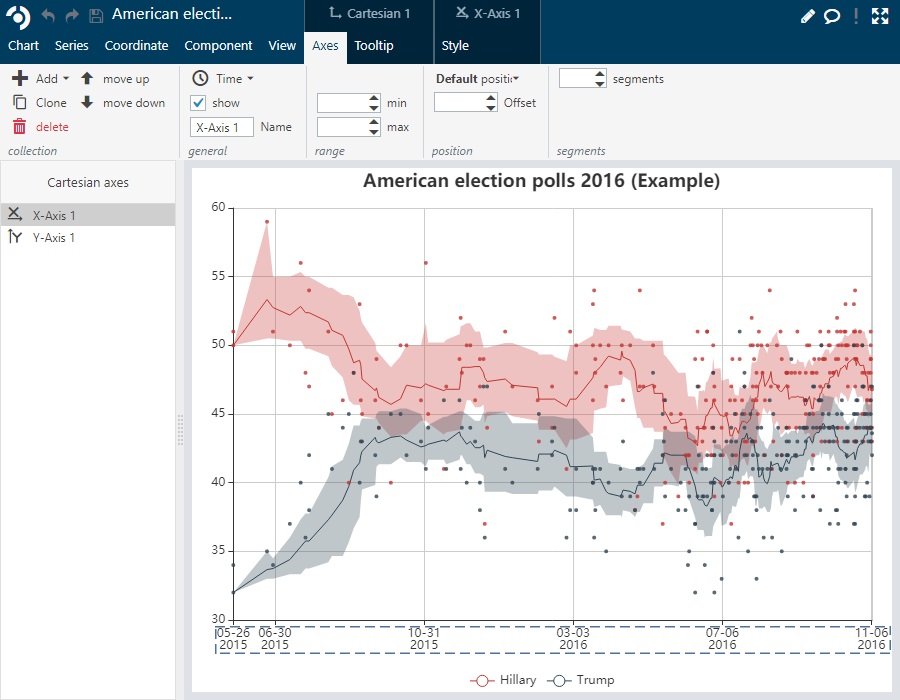
Maximized chart editor, showing the x-axis settings.

Add shortcode using the chartplot button in the classical editor.

Chartplot block in the gutenberg editor.
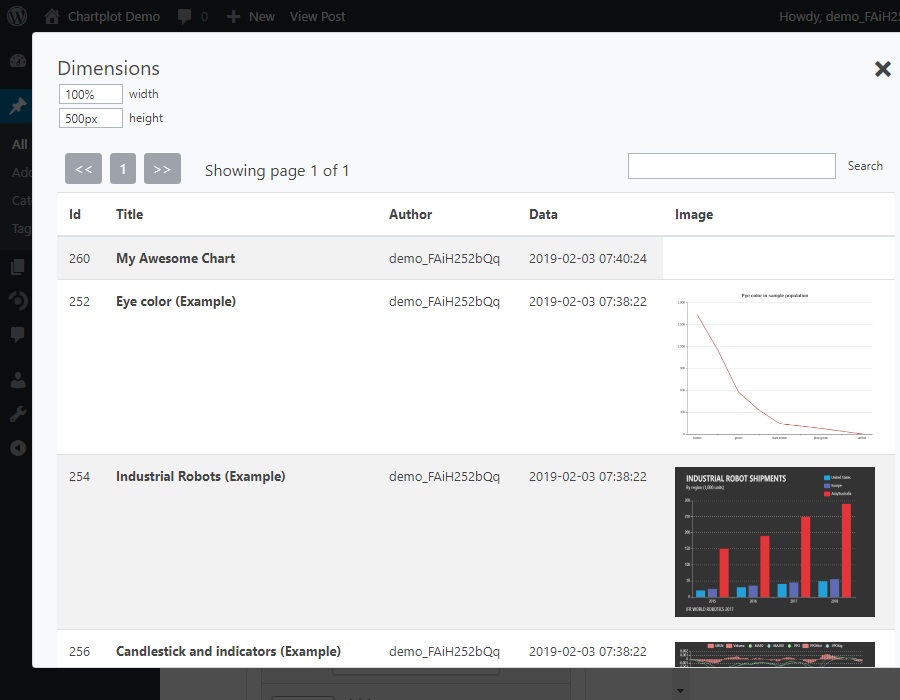
Chart selection for both classical and gutenberg editor.
Changelog
1.0.0
- First published version