SQL Chart Builder
Turn Your SQL Queries to Beautiful Dynamic Charts- Pie, Line, Area, Donut, Bar Charts with date/input filters.
Plugin info
Maintenance & Compatibility
Maintenance score
Possibly abandoned • Last updated 441 days ago • 21 reviews
Is SQL Chart Builder abandoned?
Possibly abandoned (last update 441 days ago).
Compatibility
Similar & Alternatives
Explore plugins with similar tags, and compare key metrics like downloads, ratings, updates, support, and WP/PHP compatibility.
Description
The plugin can create beautiful charts based on your SQL queries, then you can use those charts in any part of your website.
You can use both native wp and non-wp mysql tables in your queries.
Pie chart, Donut chart, Line chart, Bar chart, Column chart, Area chart
How to use
-
Give any name to your report.
-
Use our preinstalled chart or create new one yourself: choose desired chart type, type sql query,
enter field names, labels and then press to Publish/Update -
You can use multiple SQL queries too. Just split them by ; sign. You can also add shortcode argument to SQL query. For example if you
type “select * from wp_posts where ID>{arg1}” then it you can pass arg1 value to the query with [gvn_schart_2 id=”2″ arg1=”11″] shortcode. -
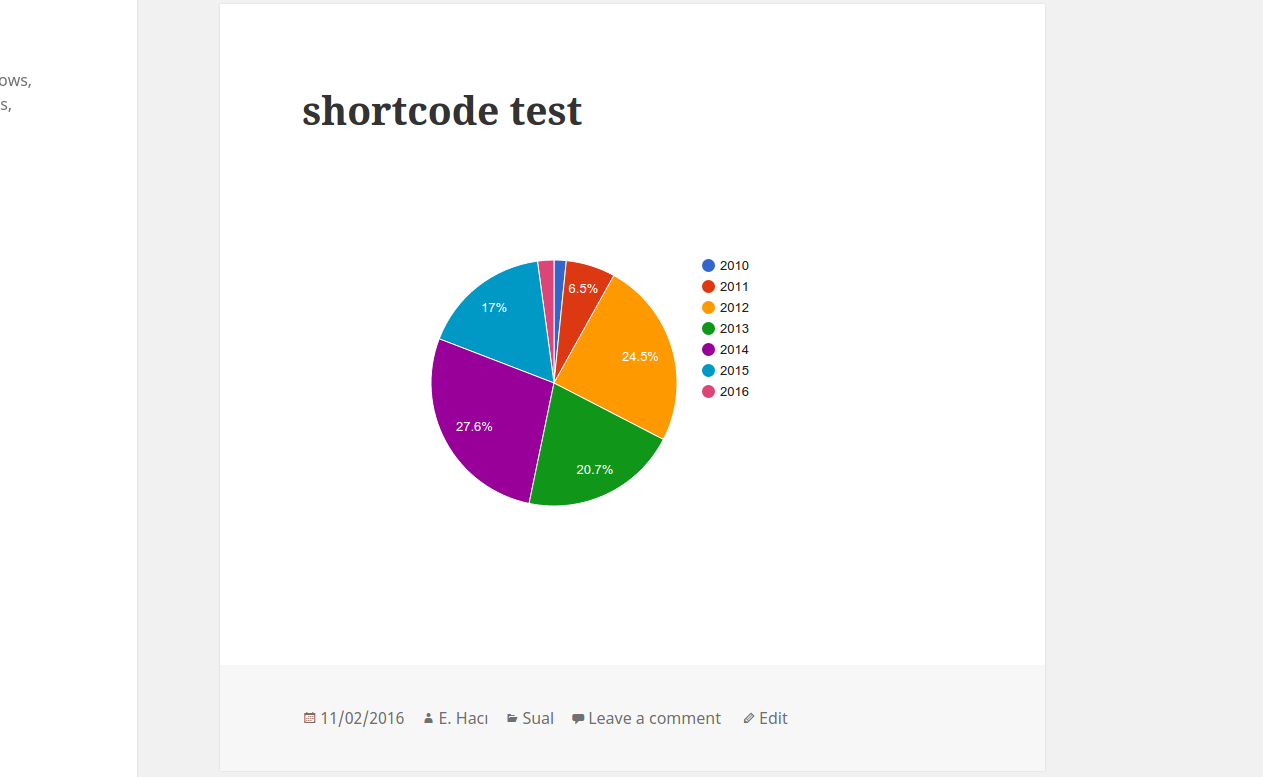
After update/save you will see needed shortcode below there. You can use that shortcode anywhere in your website: in pages, posts, widgets etc.
-
Just check “Show table-view data below the graph” in order to get table-list view below each chart.
-
Using “Dynamic Filters” you can create dynamic variables inside SQL code. It also creates corresponding dynamic input form above each chart.
Dynamic filters
Use this format: variable_name~default_value~variable_label~variable_type | variable_name~default_value~variable_label~variable_type etc.
- variable_name – any single name you want.
- default_value – default value when no any variable chosen by a user
- variable_label – Label which would be visible at a form above the chart
- variable_type – number, text or date
- ~ is a separator between variable elements.
- | is a separator between variables
For example if to put
limit_tag~10~Count~number | post_date_tag~2010-07-05 17:25:18~Date Published~date,
then you can use this SQL code
select * from wp_posts where post_date<{post_date_tag} limit {limit_tag}
in SQL CODE field.
{post_date_tag} and {limit_tag} would be replaced with dynamic variables.
So, the plugin will automatically recognize it and put corresponding selectboxes above the chart.
Website
https://guaven.com/my-sql-charts/
Documentation
https://guaven.com/my-sql-charts/#docs
Bug Submission and Forum Support
Please Vote if you liked our plugin
Your votes really helps us. Thanks.
Available Filters
apply_filters( ‘guaven_sqlcharts_table_empty_cell’);
apply_filters(‘guaven_sqlcharts_pre_print_vars’);
apply_filters( ‘guaven_sqlcharts_final_output’);
apply_filters(‘guaven_sqlcharts_rendered_sql’);
Installation
- Upload ‘guaven_sqlcharts.zip’ to the ‘/wp-content/plugins/’ directory
- Unzip it.
- Go to Dashboard/Plugins and Activate the plugin.
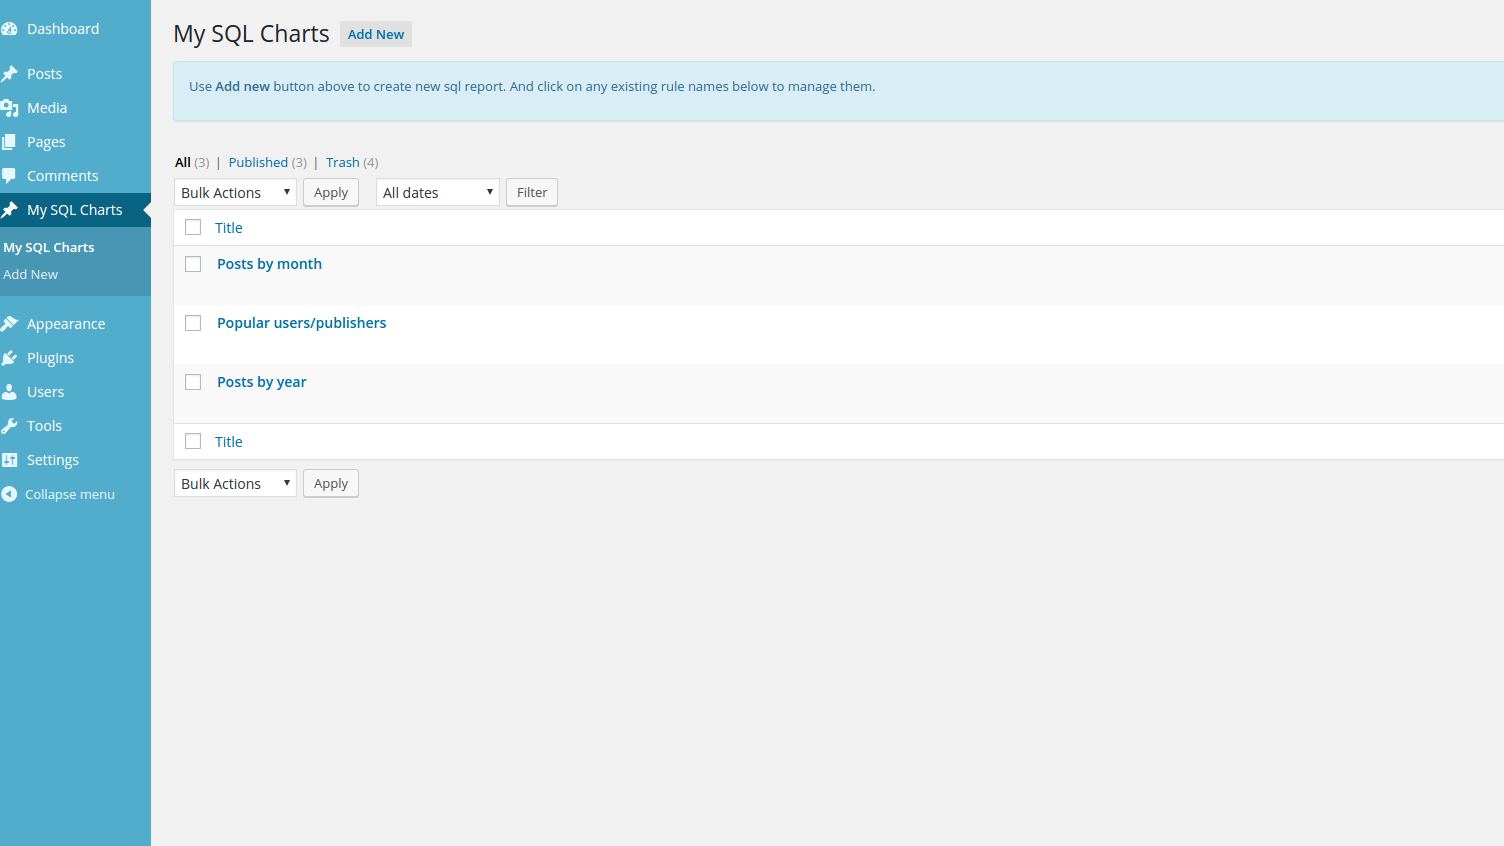
- Go to “Dashboard/My SQL Charts” to create new charts. You will also see howtouse guide texts there.
Frequently Asked Questions
Review feed
I had such high hopes :(
Screenshots
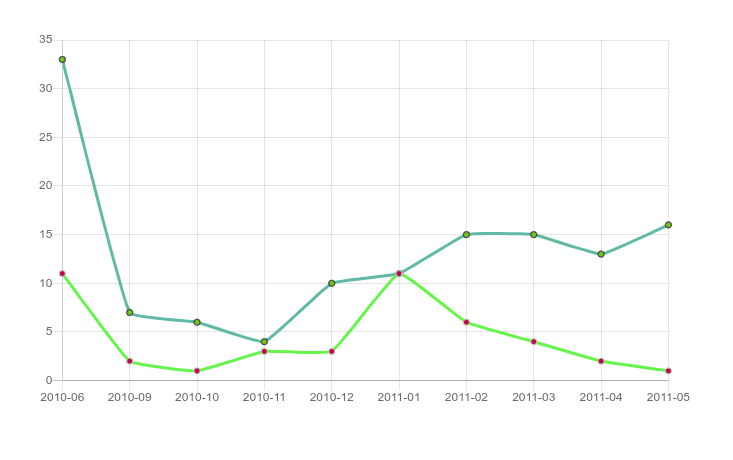
Screenshot 1
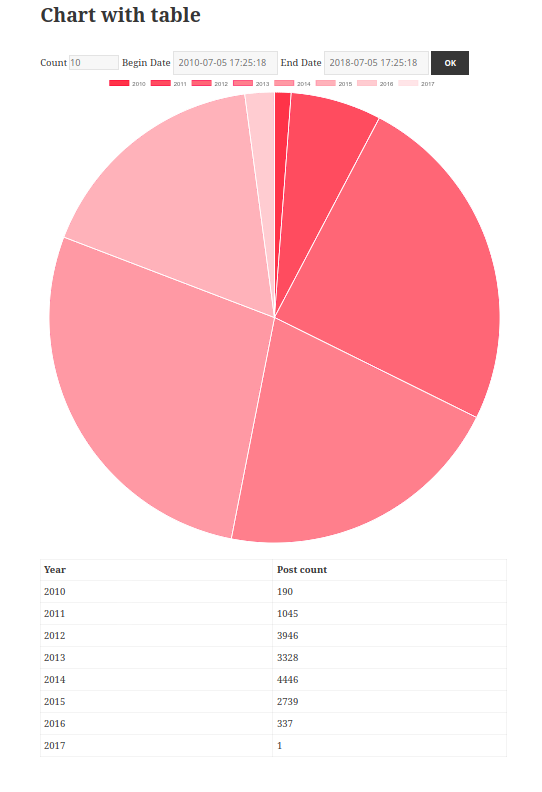
Screenshot 2

Screenshot 3
Screenshot 4

Screenshot 5
Changelog
= 2.3.7=
* Fixed small security issue
* More escape/sanitize related security improvements
= 2.3.5=
- 2 bug fixes on chart rendering X axis values
= 2.3.4=
- Backend improvements on existing features
= 2.3.3=
- Fixed: PHP warning issue
= 2.3.2=
- Added: Enable/disable Stackedness of bar charts
= 2.3.1=
- Added: Enable/disable Legend section in Charts
= 2.3.0=
-
Added: One new chart – Polar Area
-
Added: New small feature – Round Y Axis tick values
-
Improvement: Hashing DB Remote password
= 2.2.2=
-
Added: Custom color support for PIE charts
-
Added: Insert custom chart parameters via Shortcode attributes
= 2.2.1=
- Small improvements
= 2.2.0=
-
Added width-height support
-
Added “Zero point” to line chart
-
Bugfixes
= 2.1.2=
-
New feature: Remote Database Connection
-
Setting custom & fixed colors for charts
-
Small improvement in table-view component
= 2.1.1=
-
Fixed small bug in Area Charts
-
Chart library has been updated to the latest version
= 2.1.0=
-
Dynamic filters added: You can use dynamic date/number/text filters at frontend.
-
Table-view support added.
= 2.0.4=
Now you can add custom arguments to the SQL query.
= 2.0.0=
-
New non-Google Local Charts added.
-
Use multiple mysql queries in one graph.
= 1.0.0=
- Uploaded to WordPress.org
= 1.0.2=
- Little fixes
= 1.0.5=
-
Added WP 4.7 compatibility
-
Fixed “multiple charts in one page” issue.